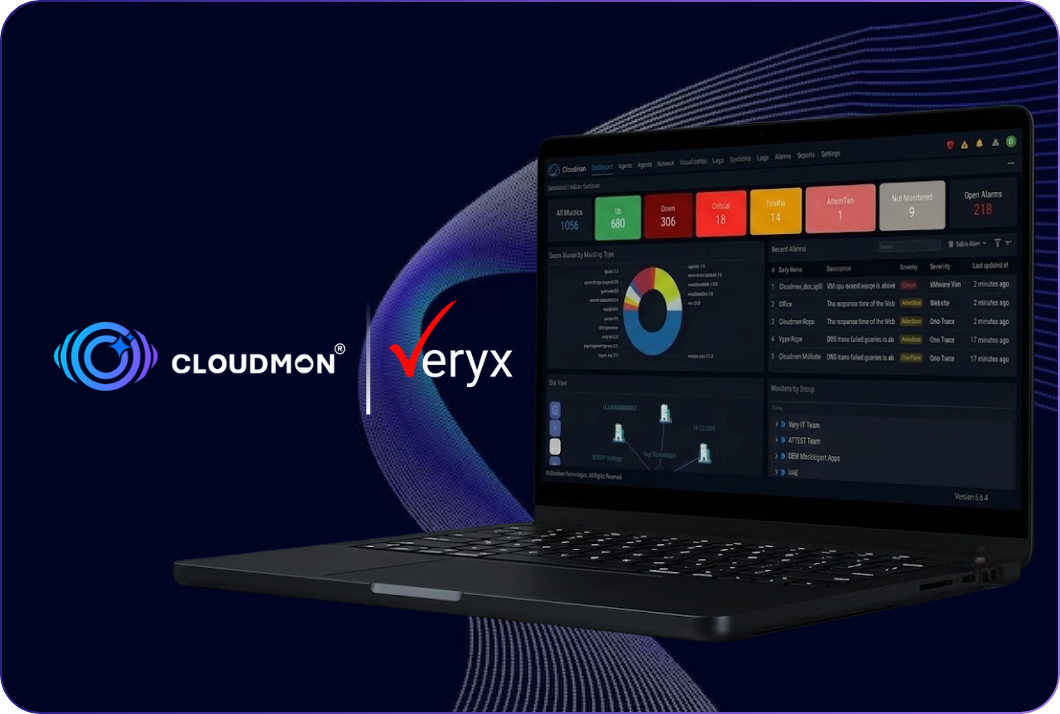

Unplanned downtime impacts revenue, productivity and customer confidence. Cloudmon provides unified visibility across servers, virtual machines, hypervisors, public cloud and endpoints, helping teams identify availability and capacity risks early, prevent disruption and protect business continuity. Deploy agents where deeper insights matter, go agentless where needed, and automate asset discovery.

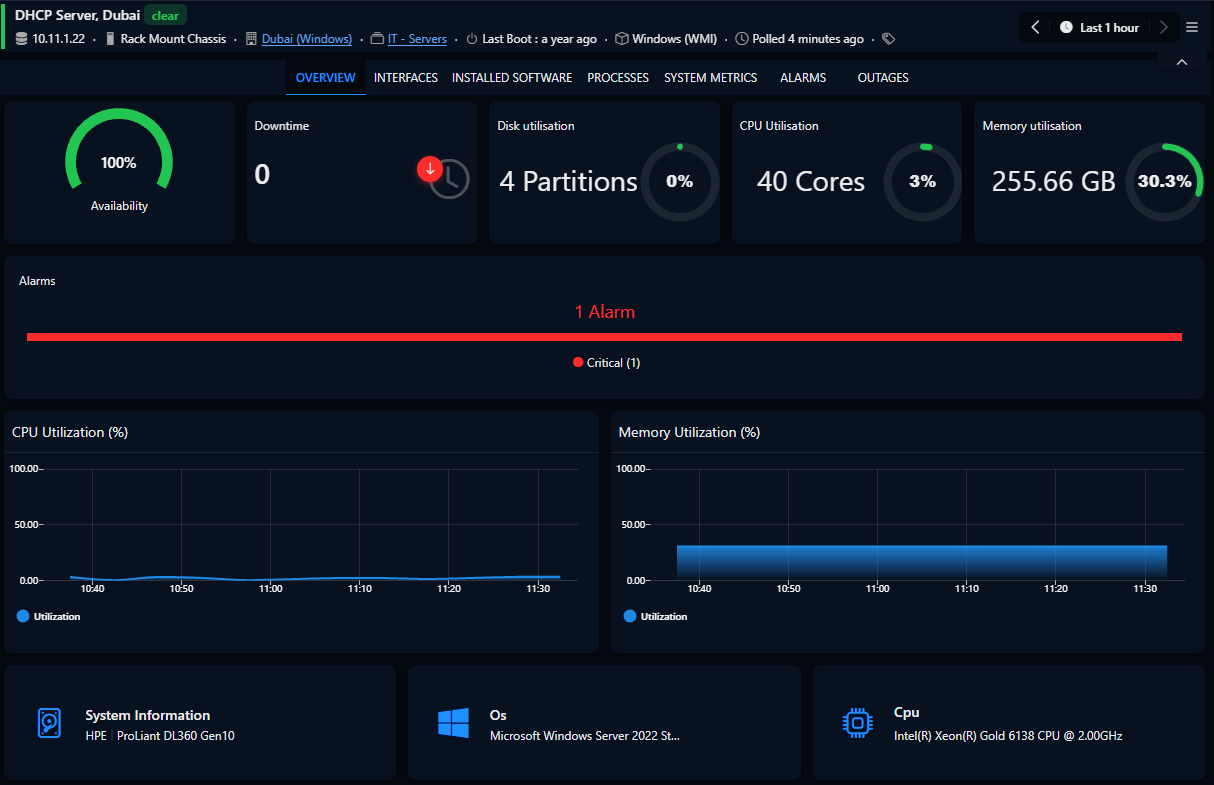
Deploy the Cloudmon agent and gain immediate visibility into server health, performance and availability. Track resource utilization, network activity, processes, software and outage history from a single view, helping IT teams identify risks early, optimize capacity and reduce downtime.
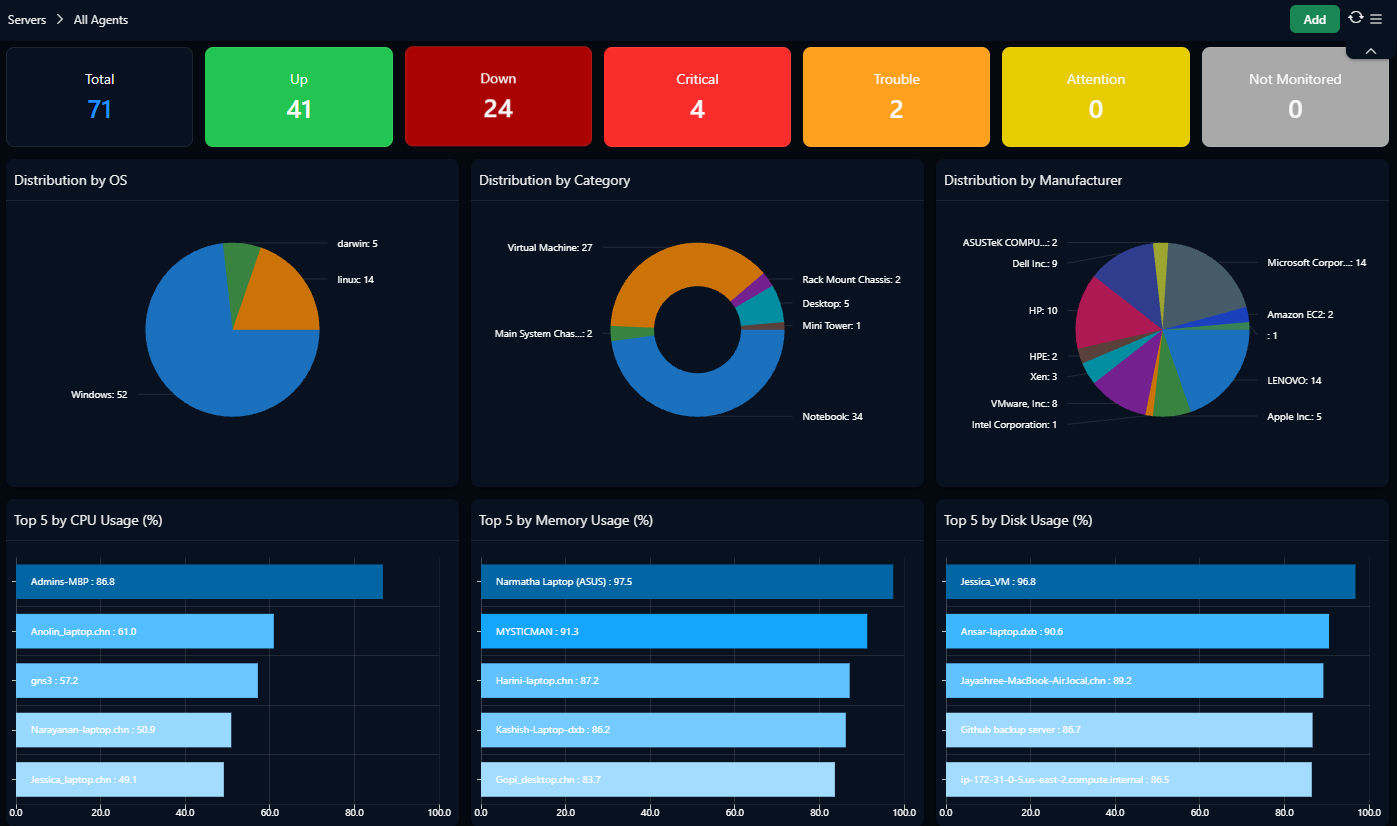
End-user device issues directly impact workforce productivity and business continuity. Cloudmon extends infrastructure visibility to desktops, laptops and mobile devices, helping IT teams identify device health, location and connectivity issues proactively, reduce support tickets and resolve disruptions before they affect employees.
Unify visibility across the three major hypervisor platforms to identify resource constraints, pinpoint affected workloads and prevent virtual infrastructure issues from disrupting business services.
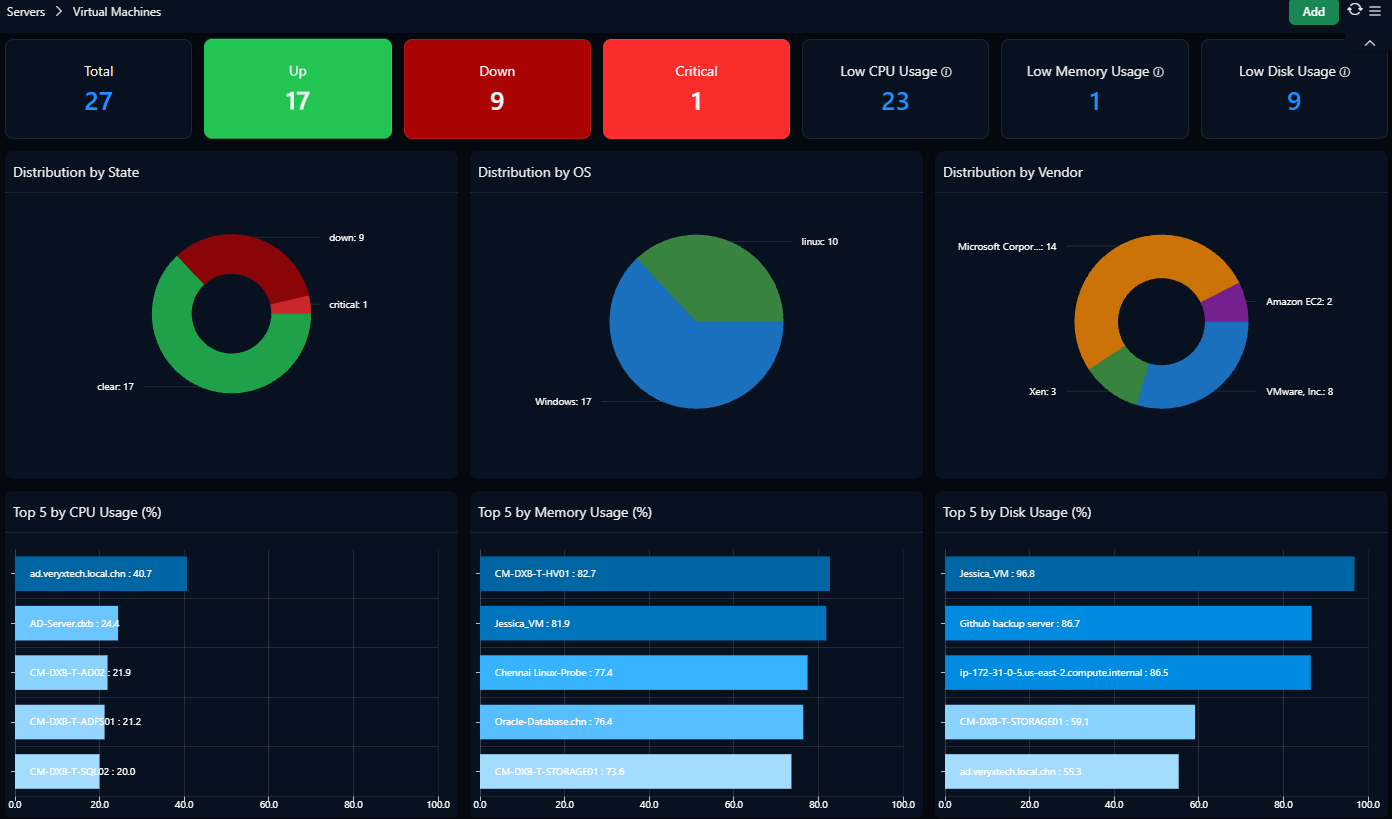
Eliminate agent deployment with 200+ performance metrics and automatic vCenter discovery, accelerating visibility while reducing monitoring overhead.
Gain end-to-end visibility across clusters, hosts, VMs and storage, with event and alert monitoring to identify risks before they impact service availability.
Gain visibility through 70+ metrics, automatic VM discovery and failover cluster monitoring to improve resilience and reduce service disruption.
Unify infrastructure inventory, resource allocation and host utilization to optimize capacity, control costs and prevent performance bottlenecks.
Auto-discovered and linked to agents, so nothing is monitored twice.
ICMP, TCP and SNMP scans build a live inventory. Monitoring in hours, not weeks.
Attention and Critical levels, so the team works the right problem first.
Downtime and incident counts for any period, per server or device.
An alert when a device stops reporting, so silence never looks like health.
Move back and forward through any window to compare before and after.
Frequently asked questions

Infrastructure monitoring tracks the health and performanceof servers, virtual machines, hypervisors, cloud resources and endpoints. Cloudmon collects these metrics in one platform so teams can spot capacity and availability problems before they cause outages.

No. The agent gives the deepest server visibility, but Cloudmon also monitors agentlessly through WMI for Windows, VMware APIs for vCenter and ESXi, SNMP for network devices, and cloud APIs for AWS and Azure.
VMware vCenter and ESXi, Nutanix through Prism Central, and Microsoft Hyper-V, all in the same console.
Yes, and Oracle Cloud Infrastructure too. Cloud resources appear alongside on-premises and virtualized infrastructure in one view. See the Cloud Monitoring page for the services covered.
The agent is built to stay out of the way ofproduction workloads.
Yes. Write a plugin in Python, PowerShell, Bash or JavaScript and Cloudmon runs it, discovers the results and handles alerting and reporting like any built-in metric. Existing plugins cover Redis, MongoDB, Nginx, SSH, DHCP and Redfish hardware health.
Yes. Android phones and tablets report memory, storage, battery level, health and temperature, OS version and time sync, with location and network details where your device policy allows.
Yes. Through Redfish, Cloudmon reads hardware health directly from the server’s management controller, alongside the OS-level metrics from the agent.


Hey, I’m Cloudmon’s AI assistant. Cloudmon unifies visibility across IT, OT, and IoT to reduce IT OPEX and strengthen security from a single platform.
How can I help you today?
🗓️ Book a demo
Introduce yourself to begin chatting with the AI assistant